KPIs
How we performed
Financial
New housing revenue (£m)
+16%
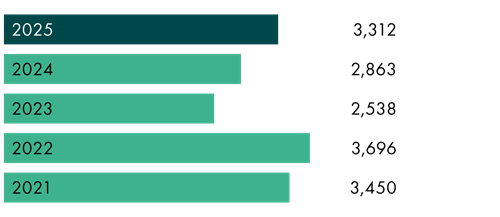
Definition
Revenue generated from the legal completion of new homes to our private customers and housing association partners.
Why we measure it
Strength of housing revenue is an important measure of the success of our strategy. Our range of house types and emphasis on quality homes at a range of price points put us in a strong position in our markets.
Forward sales at 31 December (£m)
+2%
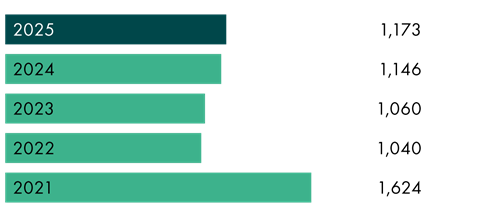
Definition
Anticipated revenue for future home sales to private customers and contracts with housing associations that have yet to legally complete.
Why we measure it
Forward sales give us an indication of the level of demand we have for homes going into future periods. This allows us to ensure we are controlling work in progress to meet demand and maintain strong financial discipline.
Underlying new housing operating margin (%)*
+20bps

Definition
Based on operating profit before net exceptional charge and goodwill impairment (underlying operating profit) and new housing revenue.
Why we measure it
We have a strong track record of delivering industry‑leading returns and we monitor our performance to ensure continued discipline in our approach.
Underlying profit before tax (£m)**
+13%

Definition
Stated before net exceptional charge and goodwill impairment.
Why we measure it
Our disciplined land replacement processes, cost management and efficiency programmes aim to generate superior returns that provide a platform for further investment in the Group’s resources to support our future growth.
Free cash generation (£m)
+£16m
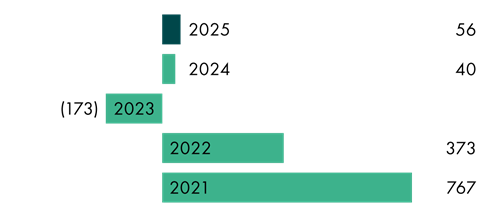
Definition
Net cash flow before financing activities.
Why we measure it
We use this to measure balance sheet strength and liquidity. Ensuring we have an appropriate capital structure to support the business through the cycle is key to our success.
Net cash (£m)
-£142m

Definition
Cash and cash equivalents, bank overdrafts and interest bearing borrowings.
Why we measure it
Ensuring we have an appropriate capital structure to support the business through the cycle is key to our success.
Return on average capital employed (%)***
+60bps
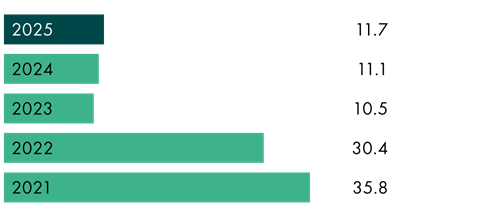
Definition
12-month rolling average calculated on underlying operating profit and total capital employed. Capital employed is the Group’s net assets less cash and cash equivalents plus land creditors.
Why we measure it
Our focus on return on average capital employed allows us to measure the efficiency of our use of capital. We will continue our disciplined approach to working capital management to meet market demand.
Net assets per share (pence)
+3%
Definition
Calculated as the total value of the Group’s assets minus total liabilities divided by the number of shares in issue.
Why we measure it
Net asset value per share movement is an indicator of the value that we are delivering for our shareholders. We have a good track record of delivering strong returns for our shareholders through the cycle.
Non-financial
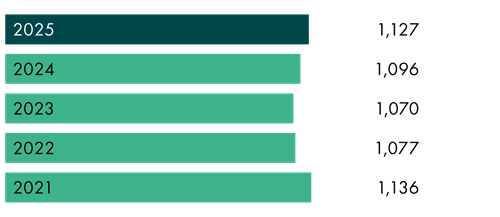
Land holdings
+3%
Definition
The number of plots we have either owned or under control to support our future home delivery.
Why we measure it
The Group’s high-quality land holdings with industry-leading margins are a key strength of the business. By monitoring them we can track our future pipeline of work.
Customer satisfaction score
-250bps
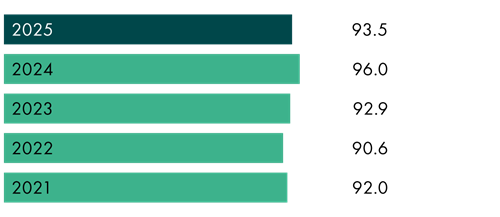
Definition
Based on the number of customers who would recommend their builder to a friend in the National New Homes Survey, run by the HBF.
Why we measure it
We put our customers at the heart of our business and ensuring they are satisfied is key to the Group’s success. We were delighted to be awarded HBF five-star builder status again in 2025. From 2026, we will report on the HBF’s combined score which is the new measure for benchmarking housebuilder star ratings.
Quality
-210bps
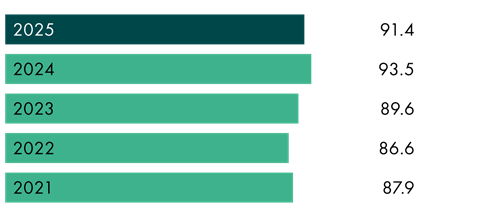
Definition
Based on how satisfied customers are with the quality of their new home in the National New Homes Survey, run by the HBF.
Why we measure it
Our ethos is to ‘build right, first time, every time’. Monitoring our performance is key to building consistently high-quality homes for our customers.
Number of work-related incidents (RIDDORs)
+1.6%
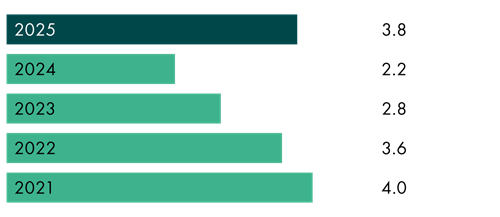
Definition
Reportable accidents, RIDDORs, reported per 1,000 workers in our housebuilding operations (including, where relevant, those reported by our subcontractors).
Why we measure it
The safety of our employees, subcontractors and customers is the number one priority for our business.
Absolute Scope 1 and 2 carbon emissions (tonnes CO2e market based)

Definition
The amount of carbon we emit from using energy in our own activities including offices, manufacturing businesses, construction sites and business travel. Energy sources include diesel, petrol, LPG, kerosene, gas and electricity.
Why we measure it
We are committed to reducing our carbon emissions, ensuring we meet our approved science-based targets, and contribute to achieving the Government’s long-term net zero carbon goal.
Notes
* Based on new housing revenue (2025: £3,312.0m; 2024: £2,863.3m) and underlying operating profit (2025: £472.1m; 2024: £405.2m) stated before net exceptional charge (2025: £44.9m; 2024: £34.4m) and goodwill impairment (2025: £3.4m; 2024: £1.6m).
** Stated before net exceptional charge (2025: £44.9m; 2024: £34.4m) and goodwill impairment (2025: £3.4m; 2024: £1.6m). Profit before tax after net exceptional charge and goodwill impairment is £397.3m (2024: £359.1m).
*** 12-month rolling average calculated on underlying operating profit and total capital employed (including land creditors). Underlying operating profit is stated before net exceptional charge (2025: £44.9m; 2024: £34.4m) and goodwill impairment (2025: £3.4m; 2024: £1.6m).